
Individual filter effluent turbidity monitoring
Follow turbidity at the outlet of an individual filter and give operators a clearer view of how each filter is performing.
Explore application

What turbidity measures, how NTU and FNU differ, and where an online turbidimeter fits in drinking water treatment.
Understand turbidityTurbidity describes how particles in a water sample scatter light. In drinking water treatment, the reading can help an operator follow the behaviour of a filter, notice changes after backwash or investigate a shift in treated water. It is an optical measurement and cannot identify which particles are present.
The first question is which water the reading describes. An individual filter outlet tells you about one filter, while a combined outlet shows the blended stream. A change at one sample point may not appear the same way at the other.
A nephelometric turbidimeter directs light through the sample and measures scattered light at an angle. In a continuous process analyser, water passes through a flow body so the instrument can provide a trend between individual samples.
Turbidity meter and turbidimeter are both used for instruments that measure turbidity. A portable or benchtop meter measures an individual sample, while an online turbidimeter follows water continuously at a defined point in the process.
That trend is only as representative as the sample reaching the analyser. Check the take-off, flow and travel time. Bubbles and changes in sample supply can affect the reading, so record service and flow events before comparing a trace with the plant’s operating record.
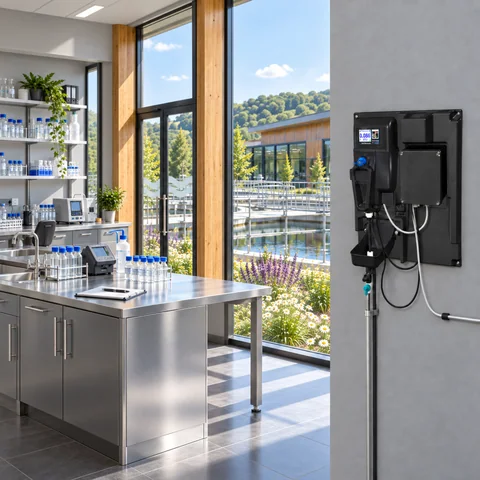
NTU and FNU are units used for nephelometric readings. The PTV 1000 white-light LED model reports in NTU, while the infrared ISO 7027 model reports in FNU. The wavelength and the way the instrument measures scattered light matter when results are compared.
Two methods may agree on a reference standard and respond differently to a real water sample. Keep the method and units with the reading, especially when replacing an analyser or comparing a continuous trend with a grab sample.

Further reading Drinking Water Inspectorate guidance on drinking water parameters
Use the water and the decision it supports to choose the sample point. The application guides show how that works in practice.
Follow turbidity at the outlet of an individual filter and give operators a clearer view of how each filter is performing.
Explore application
Track low-level turbidity in filtrate alongside the plant’s membrane monitoring programme.
Explore applicationTrack changes in turbidity at a final-water, storage or transfer point within a drinking-water system.
Explore applicationGather the sample, method and plant connection details for a discussion with PMA.
Prepare your enquiryHave the sampling point, expected turbidity and operating flow to hand.