
Turbidity monitoring before UV disinfection
Follow filtered water entering a UV treatment stage and keep the turbidity trend alongside the reactor’s own operating records.
Explore application

Track changes in turbidity at a final-water, storage or transfer point within a drinking-water system.
Read the guidanceA final-water outlet, reservoir outlet and transfer main may all see different water during the day. Walk through the paths that pumps and valves can create, then document which path supplies the sample at each operating state.
Check that the analyser still receives a representative sample during low demand and after a pump change. Consider the time taken for water to travel to the analyser so a change in the trend can be matched to the right event.
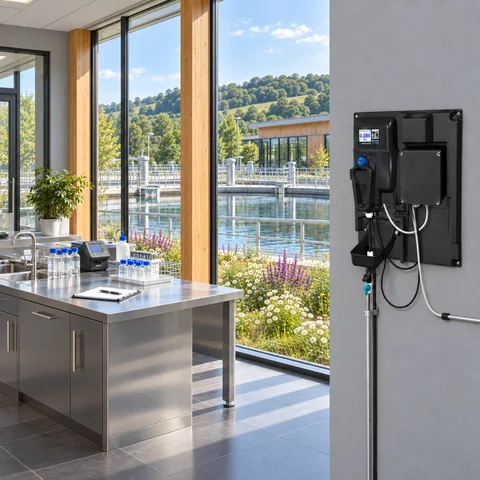
The example shows a brief change following a transfer event. Check pump and valve records, then allow for the time between the sample point and the analyser.
Illustrative readings in FNU. This example is provided for interpretation practice.
| Minute | Turbidity (FNU) |
|---|---|
| 0 | 0.050 |
| 2 | 0.049 |
| 4 | 0.050 |
| 6 | 0.051 |
| 8 | 0.078 |
| 10 | 0.073 |
| 12 | 0.052 |
| 14 | 0.048 |
| 16 | 0.050 |
| 18 | 0.049 |
Put pump starts, valve changes and maintenance events on the same timeline as the turbidity readings. If the line has been isolated, record when the sample resumed and when it became representative again.
For a comparison sample, choose a point that represents the same water and record the time and optical method. Comparing like-for-like samples is particularly useful when reviewing changes across storage turnover or transfer periods.
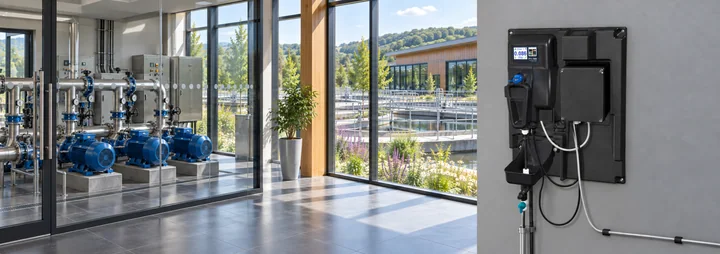
Follow filtered water entering a UV treatment stage and keep the turbidity trend alongside the reactor’s own operating records.
Explore application
Monitor the blended water leaving a bank of drinking water filters and keep the trend tied to the filters that were in service.
Explore application
Track low-level turbidity in filtrate alongside the plant’s membrane monitoring programme.
Explore application
Review the sample route, access for service and the signals you need at the plant.
Explore installationChoose where you’ll measure, which optical method applies and how the reading will reach your plant system. Save a brief for discussion with PMA.
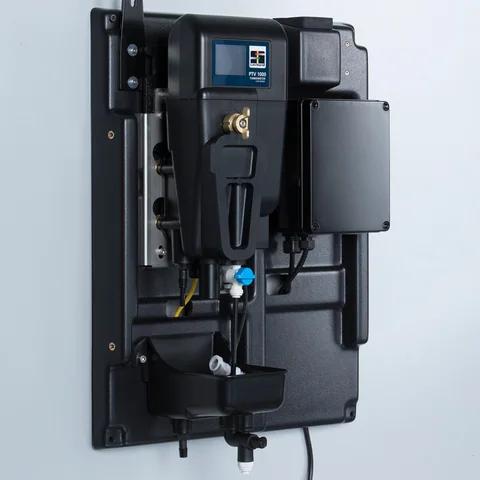
Confirm the sample conditions and exact junction box with PMA before specifying an instrument.
Gather the sample, method and plant connection details for a discussion with PMA.
Prepare your enquiryHave the sampling point, expected turbidity and operating flow to hand.