
Combined filter effluent turbidity monitoring
Monitor the blended water leaving a bank of drinking water filters and keep the trend tied to the filters that were in service.
Explore application

Follow turbidity at the outlet of an individual filter and give operators a clearer view of how each filter is performing.
Read the guidanceA sample from an individual outlet describes the performance of that filter. A sample from the combined outlet answers a different question. It describes the blended water and can mask a change at one filter, especially when the remaining filters are running steadily.
Agree what the operator needs to decide before choosing the point. If the aim is to understand how a filter returns to service after backwash, use the individual outlet and record the filter identification, backwash timing and sample travel time alongside the readings.
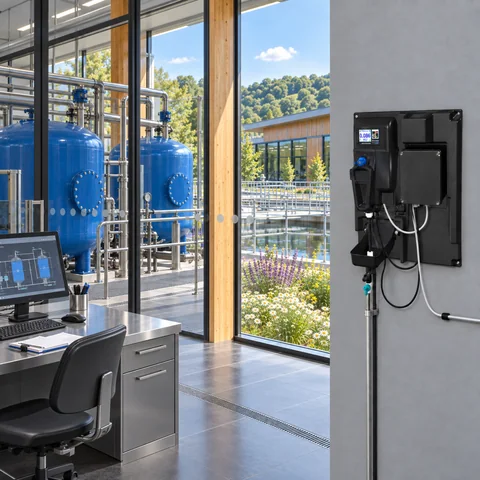
This example shows a short rise after a restart. Compare the trend with the same filter’s previous runs and allow for the sample reaching the analyser after the recorded plant event.
Illustrative readings in FNU. This example is provided for interpretation practice.
| Minute | Turbidity (FNU) |
|---|---|
| 0 | 0.035 |
| 2 | 0.035 |
| 4 | 0.040 |
| 6 | 0.120 |
| 8 | 0.150 |
| 10 | 0.090 |
| 12 | 0.065 |
| 14 | 0.050 |
| 16 | 0.045 |
| 18 | 0.040 |
A short rise after a restart can mean something different from a change that lasts through a filter run. Compare the shape of the trend with earlier runs from the same filter. Start with a baseline that covers normal operation and the site’s backwash sequence.
If the pattern is unfamiliar, check sample flow and entrained air before attributing the change to the filter. Use the installation and verification records to decide which checks are due, and compare the time of any grab sample with the time that water reached the analyser.
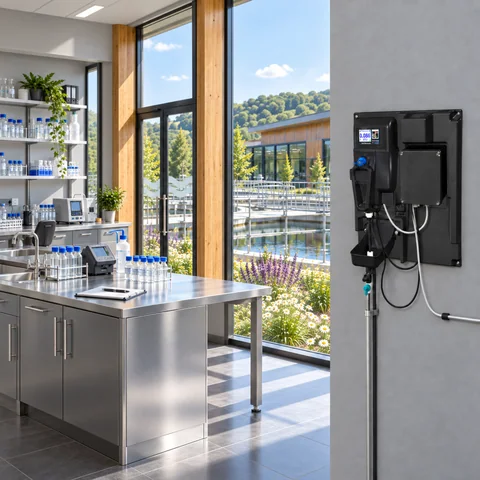
Monitor the blended water leaving a bank of drinking water filters and keep the trend tied to the filters that were in service.
Explore application
Follow the first water after backwash and match the turbidity trend to the outlet route before the filter returns to service.
Explore application
Track low-level turbidity in filtrate alongside the plant’s membrane monitoring programme.
Explore application
Review the sample route, access for service and the signals you need at the plant.
Explore installationChoose where you’ll measure, which optical method applies and how the reading will reach your plant system. Save a brief for discussion with PMA.
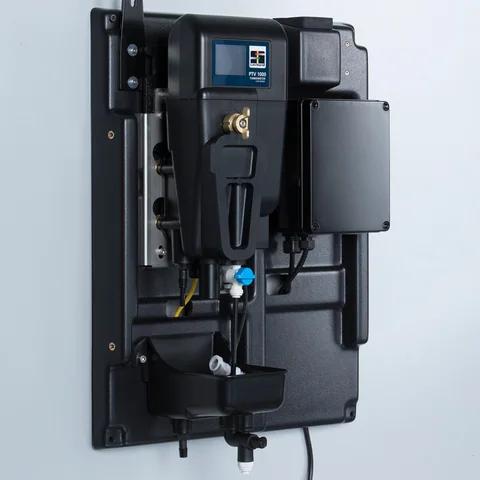
Confirm the sample conditions and exact junction box with PMA before specifying an instrument.
Gather the sample, method and plant connection details for a discussion with PMA.
Prepare your enquiryHave the sampling point, expected turbidity and operating flow to hand.