
Individual filter effluent turbidity monitoring
Follow turbidity at the outlet of an individual filter and give operators a clearer view of how each filter is performing.
Explore application

Track low-level turbidity in filtrate alongside the plant’s membrane monitoring programme.
Read the guidanceSampling one train makes the signal useful for investigating that train. Sampling the common header is more appropriate when the question is about the combined filtrate leaving the process. Record which trains contributed to the header at the time of a change.
Check which train is in service and whether its sample line is carrying fresh filtrate. Record cleaning and restart events, sample flow and the optical method so a later comparison is based on similar operating conditions.
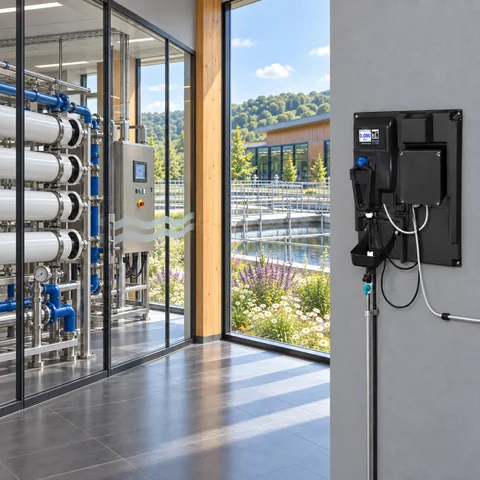
The example shows a change that persists after a train returns. Review it alongside train status, sample conditions and the plant’s integrity monitoring records.
Illustrative readings in FNU. This example is provided for interpretation practice.
| Minute | Turbidity (FNU) |
|---|---|
| 0 | 0.023 |
| 2 | 0.025 |
| 4 | 0.023 |
| 6 | 0.029 |
| 8 | 0.070 |
| 10 | 0.071 |
| 12 | 0.065 |
| 14 | 0.064 |
| 16 | 0.061 |
| 18 | 0.059 |
A change in filtrate turbidity can prompt a closer look. Review the trend with the plant’s integrity checks, the production rate and recent cleaning or restart activity. These records help the team work out which event to investigate first.
Agree who reviews an excursion and which records they should see. If the change coincides with a stopped train or a sample line intervention, confirm that the analyser is receiving representative water before comparing it with a running baseline.

Follow turbidity at the outlet of an individual filter and give operators a clearer view of how each filter is performing.
Explore application
Follow filtered water entering a UV treatment stage and keep the turbidity trend alongside the reactor’s own operating records.
Explore application
Track changes in turbidity at a final-water, storage or transfer point within a drinking-water system.
Explore application
Review the sample route, access for service and the signals you need at the plant.
Explore installationChoose where you’ll measure, which optical method applies and how the reading will reach your plant system. Save a brief for discussion with PMA.
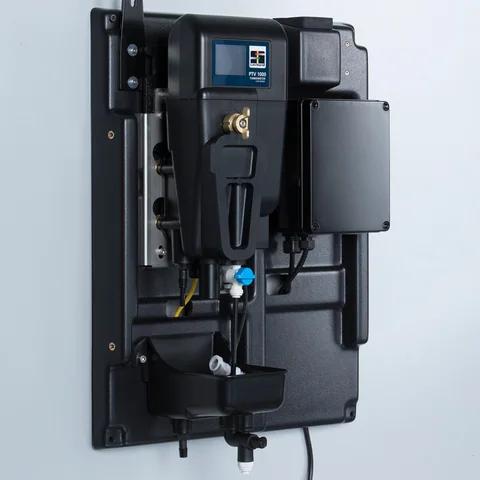
Confirm the sample conditions and exact junction box with PMA before specifying an instrument.
Gather the sample, method and plant connection details for a discussion with PMA.
Prepare your enquiryHave the sampling point, expected turbidity and operating flow to hand.