
Combined filter effluent turbidity monitoring
Monitor the blended water leaving a bank of drinking water filters and keep the trend tied to the filters that were in service.
Explore application

Follow filtered water entering a UV treatment stage and keep the turbidity trend alongside the reactor’s own operating records.
Read the guidanceA turbidity trend after filtration can show a change in the water heading towards UV treatment. Locate the sample tap in relation to the filters, any blending or bypass points and the reactor inlet. Where several reactors run in parallel, confirm which water the sample represents.
Record how the sample reaches the analyser at normal flow, low demand and after a plant change. If the PTV 1000 is being considered, check the filtered-water range and method as well as the sample pressure, flow and drainage.
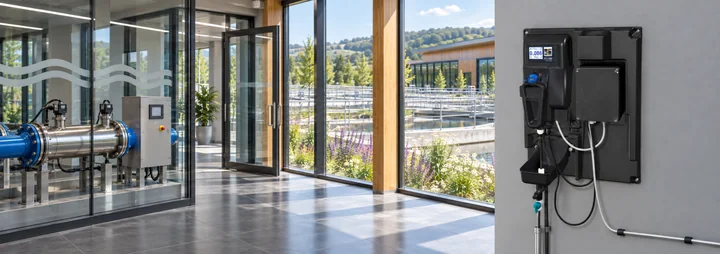
Turbidity measures how suspended material scatters light. UV transmittance describes how much UV light passes through the sample at the measurement wavelength. These readings answer different questions and require separate measurements.
A continuous turbidity trend can give operators more context for a change in upstream treatment. Assess reactor performance using the reactor’s validated operating conditions and the site’s own disinfection procedure. Keep the relevant UV intensity, flow and transmittance information alongside the turbidity trace where those measurements are available.
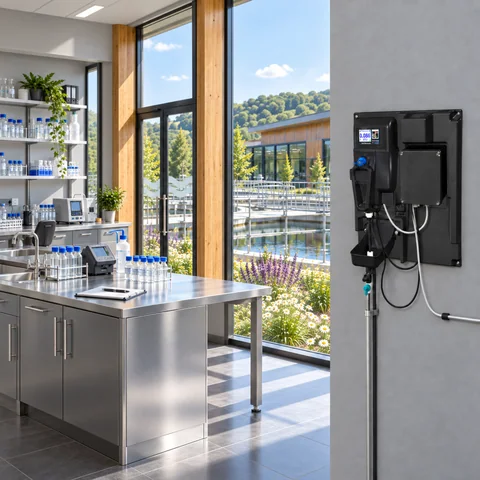
Compare a change in turbidity with upstream filter events, sample flow, reactor status and any valve movements. The timestamp at the analyser reflects when water reached the measurement chamber, so make the sample travel delay visible when matching it with process events.
Before handing the measurement over, confirm what operators should see if the analyser goes out of service or the sample is unavailable. Record the optical method and units in the historian so a later review can distinguish an instrument or sample issue from a change in the water.

Further reading Drinking Water Inspectorate guidance on UV disinfection
Monitor the blended water leaving a bank of drinking water filters and keep the trend tied to the filters that were in service.
Explore application
Track low-level turbidity in filtrate alongside the plant’s membrane monitoring programme.
Explore application
Track changes in turbidity at a final-water, storage or transfer point within a drinking-water system.
Explore application
Review the sample route, access for service and the signals you need at the plant.
Explore installationChoose where you’ll measure, which optical method applies and how the reading will reach your plant system. Save a brief for discussion with PMA.
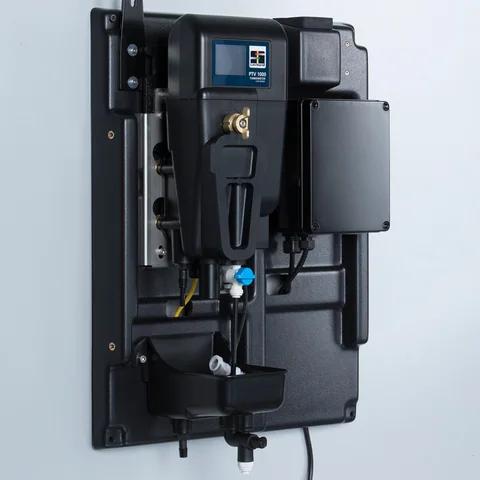
Confirm the sample conditions and exact junction box with PMA before specifying an instrument.
Gather the sample, method and plant connection details for a discussion with PMA.
Prepare your enquiryHave the sampling point, expected turbidity and operating flow to hand.