
Individual filter effluent turbidity monitoring
Follow turbidity at the outlet of an individual filter and give operators a clearer view of how each filter is performing.
Explore application

Monitor the blended water leaving a bank of drinking water filters and keep the trend tied to the filters that were in service.
Read the guidanceCombined filter effluent is the water from the filters that are feeding a common header. Sample where the streams have joined and the water can represent the outlet of the bank. Trace any bypasses, blending lines and valve positions that can change what reaches the sample tap.
A combined trend answers a plant-wide question about the blended outlet. A change in one filter can be diluted by the others, so the combined reading cannot tell the operator which individual filter changed. Keep individual filter readings available when the team needs that level of detail.

Record when each filter entered or left service, along with any change in flow or bypass operation. If the combined trend rises when a filter returns, compare the event with its individual outlet trace and the normal sample travel time. Several filters can change state within the same short period.
Keep the turbidity method and units with the trend in the historian. Note the point where any reference sample was taken and when that water reached the online analyser. If a change follows a line or valve intervention, establish that the sample is representative before comparing it with an earlier baseline.

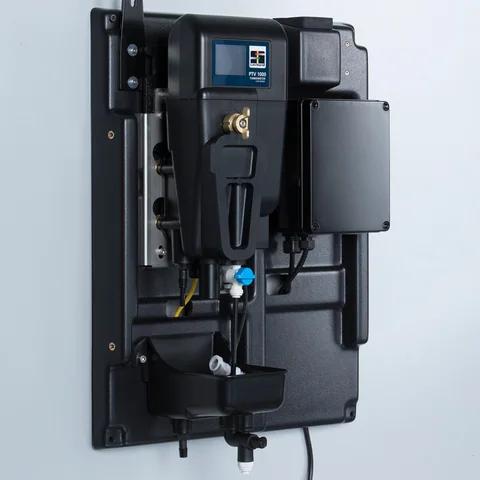
Check the expected turbidity, pressure and sample flow across different combinations of filters in service. Confirm the PTV 1000 optical model and verify that the sample and drain arrangement suit the equipment. Record what operators should see when the sample is isolated or loses flow.
Agree at handover who can see the combined trace, the individual traces and the plant event log. A common timeline gives operators a place to start if a change recurs and the person who commissioned the installation is no longer on shift.

Further reading US EPA turbidity guidance on individual and combined filter effluent
Follow turbidity at the outlet of an individual filter and give operators a clearer view of how each filter is performing.
Explore applicationFollow the first water after backwash and match the turbidity trend to the outlet route before the filter returns to service.
Explore application
Follow filtered water entering a UV treatment stage and keep the turbidity trend alongside the reactor’s own operating records.
Explore application
Review the sample route, access for service and the signals you need at the plant.
Explore installationChoose where you’ll measure, which optical method applies and how the reading will reach your plant system. Save a brief for discussion with PMA.
Confirm the sample conditions and exact junction box with PMA before specifying an instrument.
Gather the sample, method and plant connection details for a discussion with PMA.
Prepare your enquiryHave the sampling point, expected turbidity and operating flow to hand.