
Individual filter effluent turbidity monitoring
Follow turbidity at the outlet of an individual filter and give operators a clearer view of how each filter is performing.
Explore application
Follow the first water after backwash and match the turbidity trend to the outlet route before the filter returns to service.
Read the guidanceSome plants send the first water after a backwash to waste while the filter settles. Draw the route from the individual filter through the waste and service branches. Mark the sample tap and check whether the analyser receives water during each stage.
A tap on the service branch may only see a representative sample once the filter is back online. A tap upstream of the split may follow both stages, provided the sample remains representative and within the selected instrument’s operating conditions. Check the proposed point with the people who operate the filter.
Record the end of backwash, the start of flow to waste and the switch back to service as distinct events. Allow for the time water takes to reach the turbidimeter. The first reading logged after the valve changes may still represent water from the preceding stage.
Compare the trace with earlier restarts from the same filter under similar conditions. Record any change to the flow ramp, rest time or sample supply. A short excursion that repeats at the same point in the sequence calls for a different review from a persistent change under steady flow.

The site’s return-to-service procedure determines what operators do with the reading. Document the turbidity method, the sample point and the periods when data are unavailable or affected by maintenance. Make those distinctions visible when the trend is reviewed from the control room.
Check the expected range through the whole restart before specifying a low-level analyser. If the first water after backwash may fall outside the selected method’s useful range, discuss how it will be assessed with PMA and the site team.

Further reading US EPA turbidity guidance on backwash and returning filters to service
Follow turbidity at the outlet of an individual filter and give operators a clearer view of how each filter is performing.
Explore application
Monitor the blended water leaving a bank of drinking water filters and keep the trend tied to the filters that were in service.
Explore application
Track changes in turbidity at a final-water, storage or transfer point within a drinking-water system.
Explore application
Review the sample route, access for service and the signals you need at the plant.
Explore installationChoose where you’ll measure, which optical method applies and how the reading will reach your plant system. Save a brief for discussion with PMA.
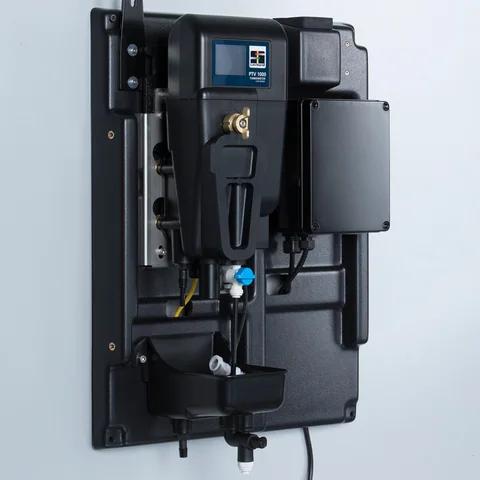
Confirm the sample conditions and exact junction box with PMA before specifying an instrument.
Gather the sample, method and plant connection details for a discussion with PMA.
Prepare your enquiryHave the sampling point, expected turbidity and operating flow to hand.